3 ways to use Listen Time to measure your podcast audience’s attention
Many podcast creators, publishers, and advertisers want the same thing: attention.
That’s why Bumper believes every podcaster should know about Listen Time: the total amount of time your audience spends with your episodes, aggregated across every podcast listening platform.
I’ll go even further: any podcaster that doesn’t measure Listen Time is at serious risk of misunderstanding the true size, composition, and engagement of their audience.
Earlier this year, I shared how Bumper calculates Listen Time for our clients, which is how we can say things like:
Episode 1 earned 500 hours of Listen Time
Episode 2 earned 1,000 hours of Listen Time
Episode 3 earned 1,200 hours of Listen Time
But there’s more to Listen Time than just one big number per episode.
Today, I want to go beyond the basics to share three different ways to look at Listen Time. I’ll explain when and why you might use them to better understand your podcast’s success. Let’s dig in.
Average Listen Time per episode
One of my favourite ways to think about audience engagement is Campfire’s framework of skimmers, dippers, and divers. It describes different levels of audience commitment, from the casual sampler (“skimmer”) to the dedicated fan (“diver”). As Campfire’s creative director Steve Coulson explains:
“We segment our audience not by type but by propensity to engage. So we have a pyramid model that consists of Skimmers, Dippers, and Divers, knowing that most people are Skimmers.”
In podcasting, we know some people will listen to an episode from beginning to end, all the way through (“divers”). Others will try the first minute or so, then stop listening (“skimmers”).
One limitation of total Listen Time (e.g. “19,700 total hours”) is how it lumps the listening behaviour of skimmers, dippers, and divers together. Consider an episode that has achieved 1,000 hours of total Listen Time. How might that have happened?
1,000 listeners, each listening for 1 hour, or
100,000 listeners, each listening for 36 seconds
Both scenarios add up to the exact same 1,000 hours of Listen Time. But the total number doesn’t answer the important question, “Did we make a good episode?”
That’s where average Listen Time per episode comes in. The formula is simple: total Listen Time per episode, divided by the number of unique listeners. The result can be expressed as MM:SS or as a percentage of the duration of an episode. For example, here’s how I like to display it:

I like the MM:SS figure because it’s easy to understand in plain English (“On average, listeners spent 42 minutes with Episode 3, which is 47 minutes long”).
Long episodes vs. short episodes
After I last wrote about Listen Time, I heard from James Cridland, editor of Podnews. He shared the concern that Listen Time penalizes short shows like Podnews Daily (which regularly publishes 3-5 minute episodes).
Indeed, it doesn’t seem fair to compare short episodes to long episodes based on MM:SS alone. That’s why I also like to express average Listen Time as a percentage of the total duration of an episode. 42:07 of 47:03 is 90% of the total duration of the episode.
Expressing average Listen Time per episode as a percentage is one way to avoid potentially unfair comparisons between short episodes and long episodes. I often recommend that podcasters set percentage-based benchmarks and goals for themselves.
One important feature of average Listen Time per episode is that it’s sensitive to both time in market and the behavior of different types of listeners. Generally speaking, we tend to see average Listen Time per episode increase with episode age. As an episode falls deeper into a show’s back catalog, the odds of skimmers hitting it decreases, and the odds of divers listening increases.
Similarly, a large influx of new listeners often depresses average Listen Time. We often see this when shows are prominently featured in podcast apps. A larger-than-usual number of skimmers often deflates average Listen Time. This isn’t a bad thing, but it’s worth remembering if you’re lucky enough to be featured by a big podcast app.
Take all this into consideration when comparing new episodes to old episodes, and when comparing well-marketed episodes to not-so-well-marketed episodes.
NB: Be cautious of the “Average Listen” metric you’ll find in Spotify for Podcasters. As I’ve written before, Spotify’s “Average Listen” uses a median average rather than a mean average, which makes it not very useful for Listen Time calculation.
Listen Time per day, week, or month
Just because a listener downloaded an episode at 8:00am on a Tuesday doesn’t mean they listened to that episode then.
Certainly, podcast hosting services can tell you when downloads happen. For example, Megaphone reports on download time of day, and Simplecast includes a popular time of day chart in their analytics dashboard. But these can sometimes be misleading, because downloads are not listens.
If you only look at when downloads happen, you risk misunderstanding when listening happens.
For example, here’s the daily download pattern of a recent episode:
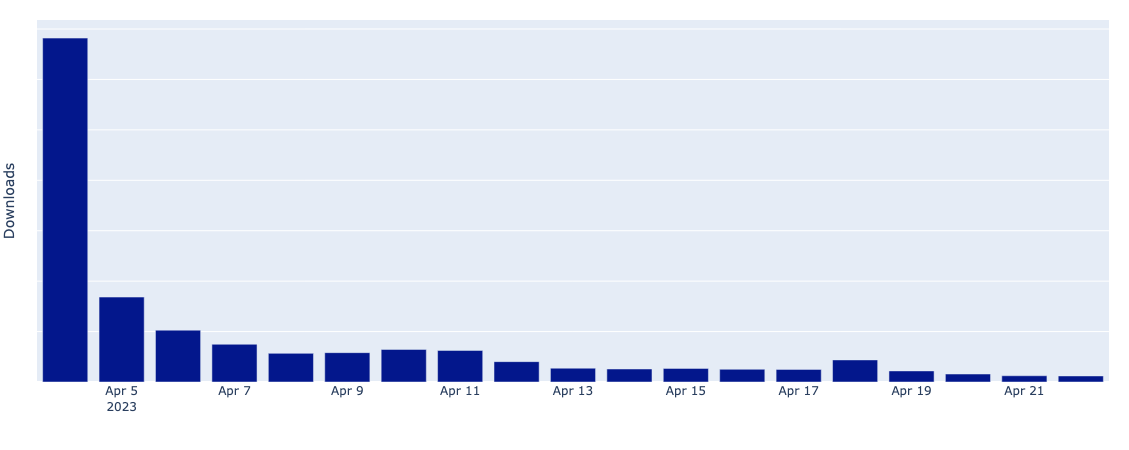
Clearly, downloads are concentrated on release day. This makes sense, given the automatic download behaviour of popular podcast apps like Apple Podcasts. If we look at downloads alone, it’s tempting to believe that a large chunk of the audience listened to the episode as soon as it was available.
The daily Listen Time breakdown, however, tells a different story:

Actual listening is much more spread out than the daily download chart might suggest.
Remember: large spikes in downloads don’t necessarily indicate large spikes in listening.
This approach – comparing downloads vs. Listen Time – works at an episodic level. It also works at the show level. By looking at Listen Time by day, week, or month, we can paint a clear picture of growth over time.
This shows Listen Time per week across all episode of a single show. As you can see, it’s steadily growing:

Nothing about this chart shows an increase in downloads. Instead, it shows gradual, incremental growth in attention.
Downloads aren’t listens, and downloads alone can’t tell you when listeners spent time with your show.
Total Listen Time

The third way to measure Listen Time is the simplest: one big Listen Time number per episode (e.g. “Episode 1 earned 5,500 hours of Listen Time across all platforms”). Here’s how Bumper calculates Listen Time for our clients.
There’s a lot to like about this number:
The unit of measure is time, which makes it easy to understand
It’s directly analogous to YouTube’s “Watch Time” metric
It’s versatile. You can look at Listen Time on a per-episode basis, or you can add multiple episodic Listen Time numbers together to get total Listen Time across a season, or an entire show.
But perhaps my favourite thing about total Listen Time per episode is that it’s the one number everyone on a podcast team can help increase. Editorial teams increase Listen Time by making great episodes. Marketing teams increase Listen Time by putting those episodes in front of the right people.
When I’m asked by senior leaders for the one big braggy number they should focus on, it’s Listen Time.
Why? Because Listen Time shows the results of great episodes, well-marketed.
Remember
Downloads aren’t listens, and downloads don’t measure time or attention
If you only measure growth through downloads, you risk misunderstanding the true size, composition, and engagement of your audience.
When your boss wants “one big number for the deck” – Listen Time is a great choice.
Listen Time can be sliced and diced to help answer different questions: by episode, by season, by day, by week, by month.